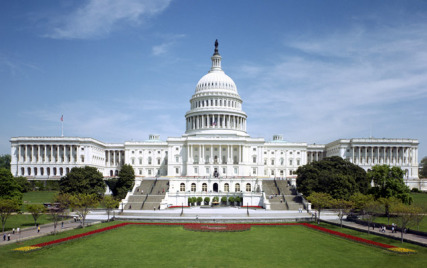
The Building of The United States Capitol
In God We Trust
Region: Washington DC
Quicksearch Query: The United States Capitol
|
Quicksearch: | |
NS Economy Mobile Home |
Regions Search |
The United States Capitol NS Page |
|
| GDP Leaders | Export Leaders | Interesting Places BIG Populations | Most Worked | | Militaristic States | Police States | |

In God We Trust
Region: Washington DC
Quicksearch Query: The United States Capitol
| The United States Capitol Domestic Statistics | |||
|---|---|---|---|
| Government Category: | Building | ||
| Government Priority: | Law & Order | ||
| Economic Rating: | Good | ||
| Civil Rights Rating: | Average | ||
| Political Freedoms: | Excellent | ||
| Income Tax Rate: | 28% | ||
| Consumer Confidence Rate: | 100% | ||
| Worker Enthusiasm Rate: | 103% | ||
| Major Industry: | Soda Sales | ||
| National Animal: | bald eagle | ||
| The United States Capitol Demographics | |||
| Total Population: | 3,931,000,000 | ||
| Criminals: | 420,452,887 | ||
| Elderly, Disabled, & Retirees: | 457,899,844 | ||
| Military & Reserves: ? | 141,407,591 | ||
| Students and Youth: | 755,538,200 | ||
| Unemployed but Able: | 613,685,372 | ||
| Working Class: | 1,542,016,107 | ||
| The United States Capitol Government Budget Details | |||
| Government Budget: | $12,089,039,962,704.45 | ||
| Government Expenditures: | $11,847,259,163,450.36 | ||
| Goverment Waste: | $241,780,799,254.09 | ||
| Goverment Efficiency: | 98% | ||
| The United States Capitol Government Spending Breakdown: | |||
| Administration: | $0.00 | 0% | |
| Social Welfare: | $592,362,958,172.52 | 5% | |
| Healthcare: | $1,066,253,324,710.53 | 9% | |
| Education: | $2,724,869,607,593.58 | 23% | |
| Religion & Spirituality: | $1,658,616,282,883.05 | 14% | |
| Defense: | $1,658,616,282,883.05 | 14% | |
| Law & Order: | $2,961,814,790,862.59 | 25% | |
| Commerce: | $829,308,141,441.53 | 7% | |
| Public Transport: | $0.00 | 0% | |
| The Environment: | $473,890,366,538.01 | 4% | |
| Social Equality: | $0.00 | 0% | |
| The United States CapitolWhite Market Economic Statistics ? | |||
| Gross Domestic Product: | $9,959,810,000,000.00 | ||
| GDP Per Capita: | $2,533.66 | ||
| Average Salary Per Employee: | $4,324.27 | ||
| Unemployment Rate: | 23.53% | ||
| Consumption: | $21,889,694,753,095.68 | ||
| Exports: | $4,032,312,557,568.00 | ||
| Imports: | $4,217,228,754,944.00 | ||
| Trade Net: | -184,916,197,376.00 | ||
| The United States Capitol Non Market Statistics ? Evasion, Black Market, Barter & Crime | |||
| Black & Grey Markets Combined: | $13,090,627,853,841.48 | ||
| Avg Annual Criminal's Income / Savings: ? | $2,851.15 | ||
| Recovered Product + Fines & Fees: | $2,454,492,722,595.28 | ||
| Black Market & Non Monetary Trade: | |||
| Guns & Weapons: | $530,477,239,670.91 | ||
| Drugs and Pharmaceuticals: | $833,607,090,911.42 | ||
| Extortion & Blackmail: | $212,190,895,868.36 | ||
| Counterfeit Goods: | $1,182,206,419,838.02 | ||
| Trafficking & Intl Sales: | $272,816,866,116.47 | ||
| Theft & Disappearance: | $272,816,866,116.47 | ||
| Counterfeit Currency & Instruments : | $970,015,523,969.65 | ||
| Illegal Mining, Logging, and Hunting : | $121,251,940,496.21 | ||
| Basic Necessitites : | $500,164,254,546.85 | ||
| School Loan Fraud : | $757,824,628,101.29 | ||
| Tax Evasion + Barter Trade : | $5,628,969,977,151.84 | ||
| The United States Capitol Total Market Statistics ? | |||
| National Currency: | dollar | ||
| Exchange Rates: | 1 dollar = $0.22 | ||
| $1 = 4.61 dollars | |||
| Regional Exchange Rates | |||
| Gross Domestic Product: | $9,959,810,000,000.00 - 43% | ||
| Black & Grey Markets Combined: | $13,090,627,853,841.48 - 57% | ||
| Real Total Economy: | $23,050,437,853,841.48 | ||
| Washington DC Economic Statistics & Links | |||
| Gross Regional Product: | $2,947,219,174,981,632 | ||
| Region Wide Imports: | $390,894,368,849,920 | ||
| Largest Regional GDP: | One Observatory Circle | ||
| Largest Regional Importer: | One Observatory Circle | ||
| Regional Search Functions: | All Washington DC Nations. | ||
| Regional Nations by GDP | Regional Trading Leaders | |||
| Regional Exchange Rates | WA Members | |||
| Returns to standard Version: | FAQ | About | About | 484,722,879 uses since September 1, 2011. | |
Version 3.69 HTML4. V 0.7 is HTML1. |
Like our Calculator? Tell your friends for us... |